The 2021 narratives provided detailed examples to justify this assessment, such as:
The Government of Burma had a policy or pattern of use of children for forced labor by the military. The international monitor-verified use of children in labor and support roles by certain military battalions increased in conflict zones, predominantly in Rakhine and Kachin States. Additionally, the military continued to rely on local communities to source labor and supplies, thereby perpetuating conditions enabling the forced labor of adThe government was actively complicit in the forced labor of North Korean workers. The government did not screen North Korean workers for trafficking indicators or identify any North Korean trafficking victims, despite credible reports in previous years that the Democratic People’s Republic of Korea (DPRK) operated work camps in Russia and exploited thousands of North Korean workers in forced labor. Although the government took steps to repatriate North Korean workers in accordance with UN Security Council resolutions (UNSCRs), citizens from the DPRK continued to arrive throughout the year, many of whom likely engaged in informal labor. While the Russian government reported the number of North Korean workers in Russia declined in 2020, the government issued almost 3,000 new tourist and student visas to North Koreans in 2020 in an apparent attempt to circumvent the UNSCRs.
FORCED LABOR IN CHINA’S XINJIANG REGION
Over the last four years, the People’s Republic of China (PRC) has carried out a mass detention and political indoctrination campaign against Uyghurs, who are predominantly Muslim, and members of other ethnic.
Criminal Justice Expenditures: Police, Corrections, and Courts
State and Local Backgrounders Homepage
Police expenditures include spending on police, sheriffs, state highway patrols, and other governmental departments charged with protecting public safety.
Corrections expenditures are for the operation, maintenance, and construction of prisons and jails, as well as the activities of probation officers and parole boards.
Court expenditures, which the Census defines as "judicial" expenditures, cover government spending on civil and criminal courts plus spending on activities associated with courts such as prosecuting and district attorneys, public defenders, witness fees, law libraries, and register of wills. It does not include probation or crime victim compensation and reparation.1
- How much do state and local governments spend on police, corrections, and courts?
- How does state spending differ from local spending and what does the federal government contribute?
- How have police, corrections, and courts expenditures changed over time?
- How and why does spending differ across states and localities?
How much do state and local governments spend on police, corrections, and courts?
In 2019, state and local governments spent $123 billion on police (4 percent of state and local direct general expenditures), $82 billion on corrections (3 percent), and $50 billion on courts (2 percent).

Nearly all state and local spending on police, corrections, and courts in 2019 went toward operational costs such as salaries and benefits (97 percent for both police and courts and 98 percent for corrections). Capital spending accounted for only 3 percent of both police and courts expenditures and 2 percent of corrections expenditures.
Capital spending has never been a large share of either police or court expenditures. From 1977 to 2019, the highest annual share of capital spending for police expenditures was 5 percent (multiple years). From 1992 to 2019, the highest share of capital spending for court expenditures was 6 percent (1997). (We do not have access to courts expenditure data for years prior to 1992.)
In contrast, capital spending on corrections, such as prison construction, was greater than 10 percent every year from 1977 to 1995. The share of capital spending on corrections reached a high of 16 percent in 1986 and 1988. However, capital spending's share of corrections spending has not been above 10 percent since 1995, and its share has been below 5 percent every year since 2010.
How does state spending differ from local spending and what does the federal government contribute?
Most spending on police was done by local governments (87 percent) in 2019. As a share of direct general spending, police spending was 1 percent of state expenditures and 6 percent of local expenditures that year. State expenditures on police mostly included spending on highway patrols, while local funds supported sheriffs' offices and police departments.
Looking at specific types of local government, police spending in 2017 (the most recent year that we have data for these levels of government) accounted for 13 percent of city direct general expenditures, 9 percent of township expenditures, and 8 percent of county expenditures.

In contrast, most direct spending on corrections was done by state governments in 2019 (62 percent). As a share of direct general expenditures, corrections spending was just over 3 percent of state expenditures and a little less than 2 percent of local expenditures in 2019. State spending on corrections included state-operated prisons, while local spending was concentrated on spending for county jails.
Spending on courts was equally delivered by state and local governments in 2019 (50 percent for each level). As a share of direct general expenditures, courts spending was 2 percent of state expenditures and 1 percent of local expenditures. Among local governments, court spending in 2017 as a percentage of general expenditures was the highest at the county level (5 percent of county direct general expenditures).

Nearly all state and local spending on police, corrections, and courts was funded by state and local governments because federal grants account for a very small share of these expenditures.
However, these totals do not include direct federal spending on criminal justice (e.g., federal prisons). The federal government directly spent $30 billion on police, $7 billion on corrections, and $15 billion on courts in 2017.
How have police, corrections, and courts expenditures changed over time?
From 1977 to 2019, in 2019 inflation-adjusted dollars, state and local government spending on police increased from $44 billion to $123 billion, an increase of 179 percent. Among major programs, the spending growth on police trailed both public welfare and health and hospitals and was roughly equal with higher education. However, much of the increase in public welfare spending, which saw the largest growth, was driven by federal spending increases on Medicaid.
Over the same period, real corrections expenditures increased from $18 billion to $82 billion, an increase of 347 percent. Spending growth on corrections over this period was higher than all other major programs except for public welfare. However, this in part reflects the relatively low spending on this program. In real dollars, corrections spending increased $64 billion from 1977 to 2019 while public welfare increased nearly $600 billion. (For more information on spending growth see our state and local expenditures page.)

We do not have access to court spending back to 1977, but from 1992 to 2018, in 2019 inflation-adjusted dollars, state and local government spending on courts increased from $30 billion to $50 billion, an increase of 66 percent.
As a share of all state and local direct general expenditures, none of these criminal justice expenditures changed much over the past 40-plus years. However, that consistency is mostly a reflection of how much state and local governments spend on other programs, and particularly elementary and secondary education and public welfare (which includes Medicaid), both of which account for roughly one-fifth of state and local direct general expenditures. From 1977 to 2019, police spending has consistently accounted for roughly 4 percent of direct state and local general expenditures. Over the same period, corrections spending as a share of state and local spending increased slightly from 1.6 percent to 2.5 percent. Court spending as a percentage of state and local direct general expenditures remained under 2 percent from 1992 to 2019.
How and why does spending differ across states and localities?
Across the US, state and local governments spent $375 per capita on police protection in 2019. The District of Columbia3 spent the most per capita on police in 2019 at $928, followed by New York ($553), California ($527), and Alaska ($522). The lowest-spending per capita states in 2019 were Kentucky ($184), Indiana ($229), West Virginia ($237), and Arkansas ($239).
Data: View and download each state's per capita spending by spending category
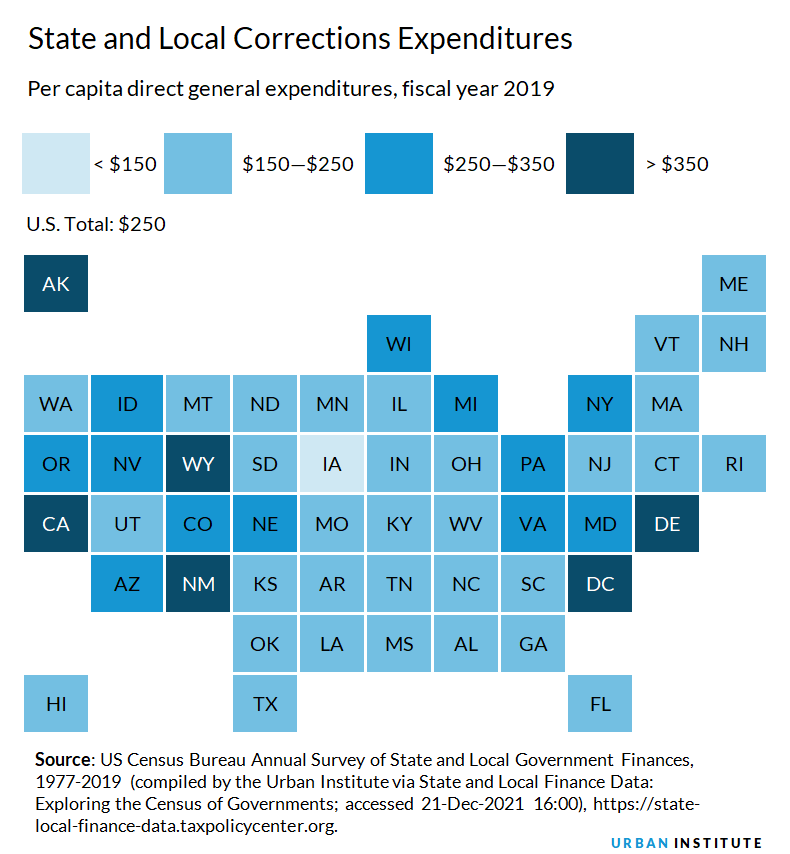
State and local governments spent $250 per capita on corrections in 2019. Alaska spent the most per capita on corrections in 2019 ($461), followed by Wyoming ($387), California ($381), and Delaware ($368). The lowest-spending states per capita in 2019 were Iowa ($145) and South Carolina ($157).

Note: For corrections spending, please use our State and Local Finance Data tool.
In 2019, states and local governments spent $152 per capita on courts. Alaska spent the most on courts per capita in 2019 ($331), followed by the District of Columbia ($243) and California ($233). The lowest spending states in 2019 were Arkansas ($79) and North Carolina and South Carolina ($81).

Per capita spending is an incomplete metric because it does not provide any information about a state’s demographics, policy decisions, or administrative procedures.
For example, states with high per capita spending on police tend to have high levels of spending per employee, reflecting the labor-intensive nature of police work. Thus, cost of living differences account for some of the variation in per capita spending.
Meanwhile, states with high per capita spending on corrections are a mix of states with high labor costs and large populations of individuals in local or state prisons or under parole or probation, such as Alaska or Delaware. States that spend more per capita tend to have higher costs of living, driving wages up.
However, police and corrections employees are often paid above the amount that these labor market conditions might predict. Some states with moderate per capita corrections costs, such as Georgia, compensate for a high number of people in prison, on probation, or on parole by employing fewer staff per inmate, probationer, and parolee, and by spending less per employee on payroll costs.4
There are also significant differences in police spending across localities simply because different levels of government fund police (and other services) in different states. For example, the city of Las Vegas, Nevada spent less than 2 percent of its budget on the police in 2019, but Clark County, Nevada spent 13 percent. In contrast, police spending was a little over 1 percent of the Cook County, Illinois, budget in 2019 but 18 percent of the Chicago city budget. New York City spent nearly $6 billion on police in 2019 but that was just 6 percent of its budget in part because New York City public school spending was included in the city's budget—and accounted for a third of the city’s spending.
The average spending on police for jurisdictions with more than one million people was 9.7 percent in 2017. The average for jurisdictions with fewer than 50,000 people was 16.7 percent. Again, this variation is driven in large part by what particular services jurisdictions deliver (and do not deliver).
Interactive Data Tools
Reducing mass incarceration requires far-reaching reforms
What everyone should know about their state’s budget
State and Local Finance Data: Exploring the Census of Governments
Further Reading
Following the Money on Fines and Fees
Aravind Boddupalli and Livia Mucciolo (2022)
What Police Spending Data Can (and Cannot) Explain amid Calls to Defund the Police
Richard C. Auxier (2020)
Criminal Justice Finance in the COVID-19 Recession and Beyond
Richard C. Auxier, Tracy Gordon, Nancy G La. Vigne, and Kim S. Rueben (2020)
Promoting a New Direction for Youth Justice: Strategies to Fund a Community-Based Continuum of Care and Opportunity
Samantha Harvell, Chloe Warnberg, Leah Sakala, and Constance Hull (2019)
Public Investment in Community-Driven Safety Initiatives
Leah Sakala, Samantha Harvell, and Chelsea Thomson (2018)
Justice Reinvestment: A Toolkit for Local Leaders
Helen Ho, S. Rebecca Neusteter, and Nancy G. La Vigne (2013)
Data Snapshot of Youth Incarceration in Connecticut
Hanna Love, Elizabeth Pelletier, and Samantha Harvell (2017)